Monitoring OpenVMS Servers with Modern Tools
OpenVMS has long been a cornerstone of mission-critical computing. But as the pool of skilled engineers shrinks, visibility into how these systems are performing has never been more important.
Chris Walker
OpenVMS has been powering mission-critical infrastructure since 1977 - arriving just in time for the boomer generation entering the workplace. Many of the most experienced OpenVMS engineers alive today came from that era. They are now retiring, and their positions are not being filled in sufficient numbers by new recruits.
This has created what we call Tribal Knowledge Architecture. Critical operational knowledge held by one or two individuals, with no structured way to capture or replace it when they move on. The system keeps running - until the person who knows it doesn't.
The challenge isn't always migration. Over the last five to ten years, many organisations have set migration deadlines that have run years past their targets. And those that do migrate don't always get what they expect - OpenVMS has a reliability record that is difficult to replicate elsewhere.
The real opportunity is integration. Keeping OpenVMS running, but connecting it to modern monitoring tools so that organisations maintain visibility and control without needing deep in-house expertise.
Historically, how was OpenVMS monitored?
Historically, OpenVMS had built-in functionality for monitoring. Tools like ANALYSE/ERROR, SDA, and T4 provided useful performance data, but required engineers to be proactive - running daily, weekly, and monthly system checks on every server. There was no integration with modern observability platforms, and no way to generate automated alerts.
That picture has changed.
VMSSPI: The Bridge to Modern Monitoring
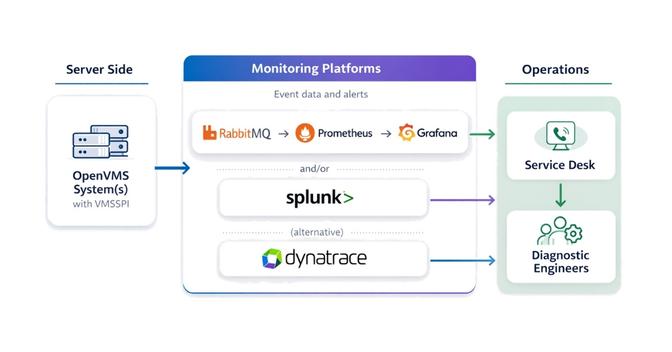
Thanks to VSI's VMSSPI layered product, OpenVMS can now send alerts to a wide range of modern monitoring solutions, including RabbitMQ, Splunk, Dynatrace, Slack, Datadog, PagerDuty, and MQTT brokers. This opens the door to integrating OpenVMS into enterprise monitoring stacks alongside Linux, Windows, and cloud workloads.
VMSSPI runs as a set of processes within OpenVMS, generating and forwarding alerts to chosen endpoints. Configuration is handled through two files:
- VMSSPI$CONFIGURATION.DAT - defines event classes and filters
- MESSAGES.TXT - specifies which monitoring modules to use
One important note from experience: OpenVMS generates a significant volume of events. When first installing VMSSPI, it is advisable to limit the events being routed to a small subset, then expand the configuration over time. Routing too many events can affect performance on the OpenVMS server - and in extreme cases, can bring the server down.
Only two monitoring technologies can be enabled at any one time, which is understood to be a performance consideration.
VMSSPI does require OpenVMS to be using TCP/IP services and does not work with TCPware.
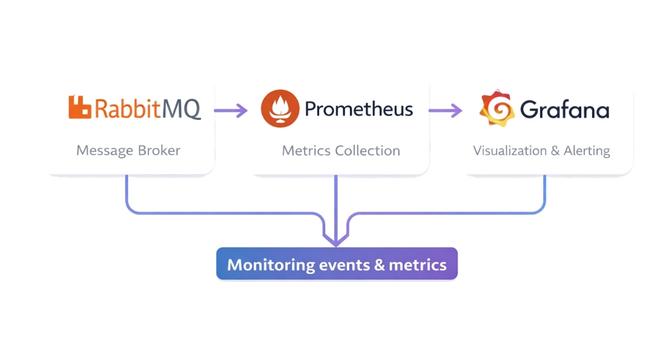
RabbitMQ + Prometheus + Grafana
For larger estates, the RabbitMQ, Prometheus, and Grafana stack is the recommended approach.
- Events from VMSSPI are routed into queues in RabbitMQ, separated by severity (critical, major, minor, etc.)
- Prometheus scrapes RabbitMQ's endpoints for queue statistics
- Grafana dashboards display alert counts and trends
This stack can be simplified by running all three in Docker. Docker can also be run in swarm mode for clustering and high availability, though this adds additional configuration complexity. An understanding of YAML configuration files is an advantage, as all three products use them.
One practical limitation worth noting: Prometheus is very effective at monitoring aggregated events, but per-object monitoring can significantly affect performance. In practice, this means the service desk will know there is a critical issue but may not immediately be able to pinpoint which specific server or cluster is affected.
To address this, RabbitMQ can be configured to route events to separate queues before they reach Prometheus. A bespoke application can also be developed to allow drill-down into individual events and identify specific hostnames - giving diagnostic engineers the information they need to act quickly.
There is no hard limit on the number of monitoring objects - it depends on the power of the server, available memory, and a number of other factors. Scaling is possible but adds further complexity to the stack.
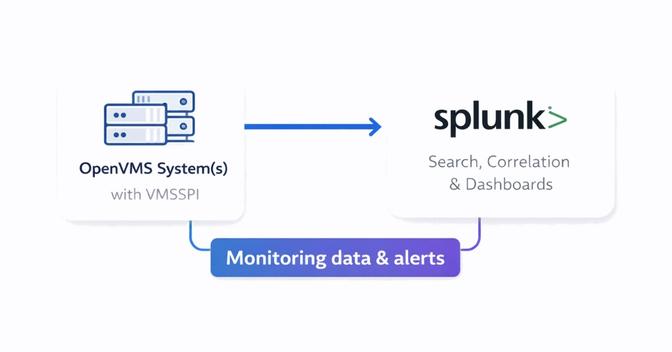
Splunk Integration
Splunk is a strong option for smaller estates where per-object coverage is important.
- A Splunk administrator creates an HTTP Event Collector (HEC) token
- VMSSPI is configured to send alerts using that token
- Events appear in Splunk's search interface, where dashboards can be built quickly
From experience, a functional monitoring dashboard can be built within a couple of hours. Splunk's flexibility makes it well suited to ad-hoc analysis and reporting, and it supports per-object event visibility that the RabbitMQ stack does not easily provide.
A few practical considerations: there is a free version of Splunk, but it is for personal use only. Commercial environments require a licence. Splunk Enterprise can be clustered for scalability and high availability, though clustering typically requires a minimum of three servers, which increases licensing costs significantly.
A useful performance indicator: if Splunk's forwarder management homepage takes more than 30 seconds to load, or if searching for a hostname runs slowly, performance is likely becoming an issue - and it may be time to consider moving to the RabbitMQ stack.
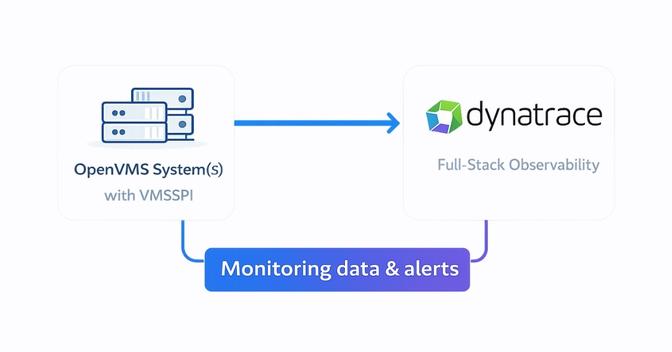
Dynatrace Monitoring
Dynatrace offers deep observability with AI-driven insights and is worth considering if your organisation already uses it to monitor other systems.
- VMSSPI is configured with a Dynatrace API v2 token with the necessary scope
- Events flow into Dynatrace, where dashboards and "Problems" pages highlight issues
- Filters can be applied to focus on specific environments or event types
Dynatrace has strong built-in support for many mainstream products, but OpenVMS is not one of them. Integration relies on Dynatrace's open REST API, and filtering events for specific environments and event types can be complex - this is typically where the most configuration time is spent.
For small estates, per-object monitoring in Dynatrace preserves data fidelity. For larger estates, aggregated statistics reduce payload size and improve performance. Like Splunk, Dynatrace can be clustered, but the minimum recommended cluster size of three servers means licensing costs increase considerably.
The recommendation is straightforward: only use Dynatrace for OpenVMS monitoring if your organisation is already invested in it for other systems.
Choosing the Right Approach
The right monitoring stack depends on the scale of your environment and the tools your organisation already uses.
- RabbitMQ/Prometheus/Grafana: best for large estates where aggregated monitoring and scalability are the priority
- Splunk: strong for smaller estates needing per-object visibility, search, and quick dashboard creation
- Dynatrace: the right choice only if your organisation is already using it elsewhere
For small estates, per-object monitoring preserves data fidelity. For larger estates, aggregated statistics reduce payload and improve performance - but some granularity is lost. It is a balancing act, and the right answer will differ for every environment.
How Newcorp Fits In
Newcorp already has the infrastructure and expertise to monitor OpenVMS environments in place. When alerts are generated by an OpenVMS environment, they flow directly into our Service Desk, which acts as the first point of triage - reviewing alerts, identifying potential issues, and determining whether further investigation is required.
Where an alert indicates a genuine problem, it is escalated to our Diagnostic Engineers. These are specialists in OpenVMS environments who can investigate logs, identify the underlying cause, and implement fixes or recommend corrective action - working alongside your internal teams where needed.
The aim is straightforward: to ensure OpenVMS systems remain stable, monitored, and properly supported, without organisations needing to maintain that level of specialist expertise internally.
Conclusion
Monitoring OpenVMS servers no longer means relying on legacy tools or manual daily checks. With VMSSPI, administrators can connect OpenVMS to RabbitMQ, Splunk, Dynatrace, and beyond - gaining real-time visibility, proactive alerting, and integration with modern enterprise monitoring strategies.
Whether you are managing a handful of servers or a global estate, modern monitoring ensures OpenVMS continues to deliver reliability in today's hybrid IT environments.
To find out more, contact us at enquiries@newcorp.co.uk or call 01477 500766.
More articles
View all
The Rdb Conundrum and Ways to Solve It
Oracle's decision to end Rdb support on OpenVMS X86 has been on the cards for years. With the Malmö Bootcamp 2026 bringing the conversation into the open, we look at the options available to Rdb customers who want to plan their next move.

Note from an old DEC-hand
Ken Olsen once called VMS the best operating system for business. Technically, he had a point. The case for OpenVMS is rarely lost on engineering - only on marketing.

OpenVMS New Developments in 2025
OpenVMS is evolving in 2025 with a major focus on x86 support, cloud integration, and modernisation strategies.
Comments are reviewed before they appear publicly.
Comments (0)
No comments yet. Be the first to add one.